
Use Reports to see how your leads, money and projects are doing, and to download what you see. The pictures in this guide use example data.
Select Reports in the sidebar. Three tabs sit at the top: Lead Reports, Financial Reports and Project Reports.
Review your leads
Open Lead Reports. It opens on This Year.
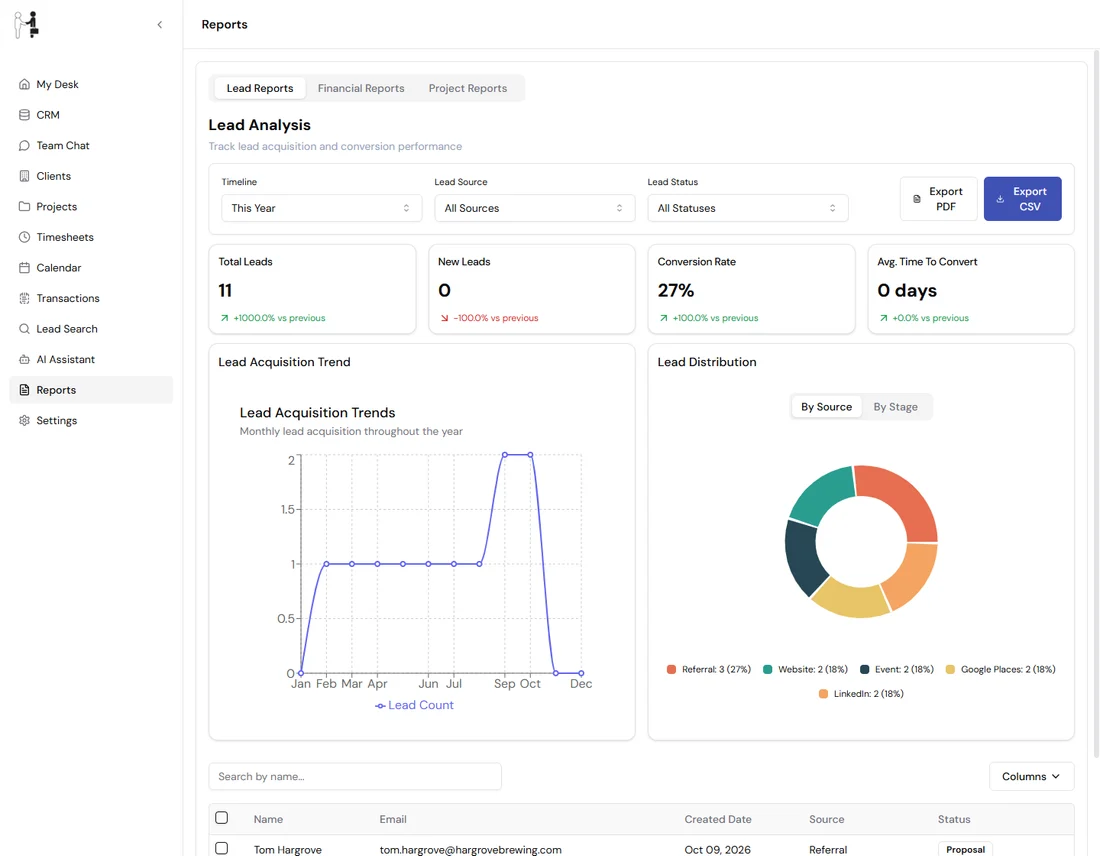
Figure 1. The cards, trend and chart change when you change a filter.
- Choose a Timeline: Today, This Week, This Month, This Quarter, This Year, Last Year or All Time.
- Choose a Lead Source: All Sources, Website, Referral or Social Media.
- Choose a Lead Status: All Statuses, Lead, Qualified, Opportunity, Proposal, In Negotiation or Lost.
The four cards show Total Leads, New Leads, Conversion Rate and Avg. Time To Convert, each compared with the period before. A lead counts as converted when its stage is Won or Qualified. Lead Acquisition Trend shows leads per month. Lead Distribution shows where leads came from under By Source, or how far along they are under By Stage.
Contacts from other sources, such as an event or Google Places, count when All Sources is chosen, but you cannot pick them on their own.
The table at the bottom lists your 100 most recent leads that match the filters. Type in Search by name... to find one, use Columns to hide or show a column, and use Previous and Next to move through the pages.
Review your money
Open Financial Reports.
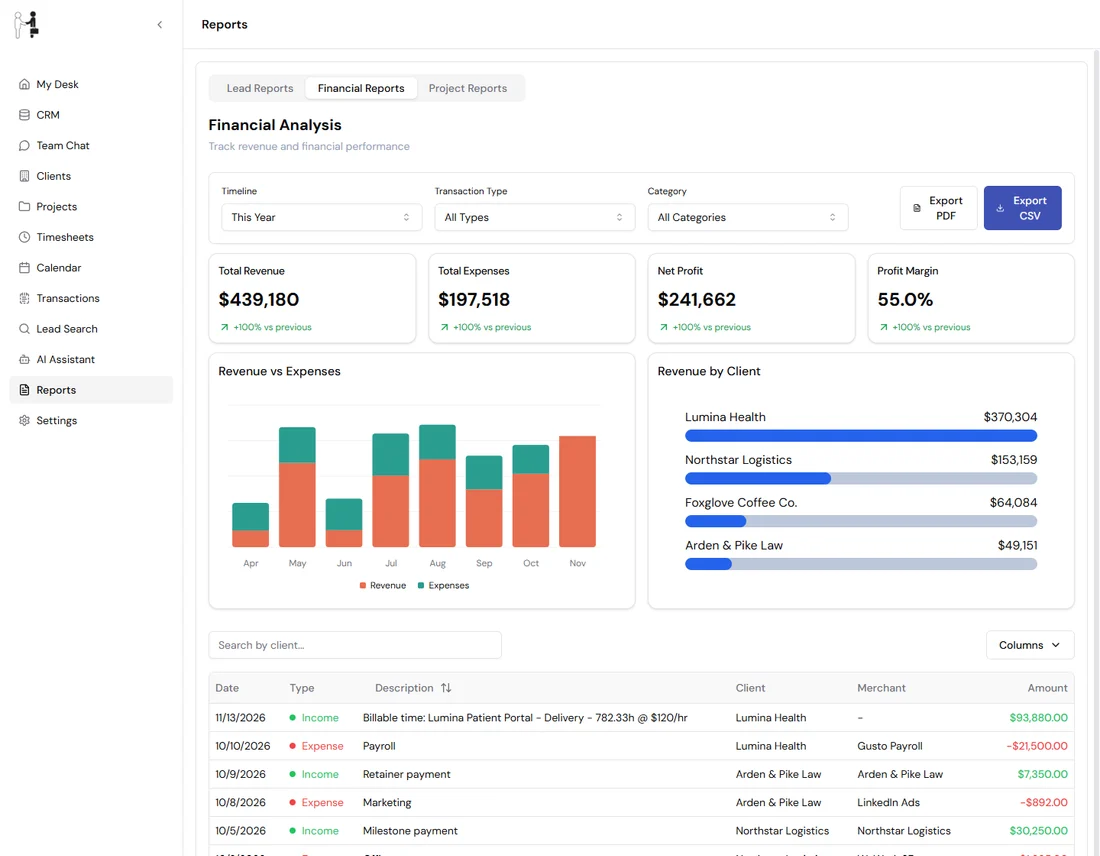
Figure 2. Revenue, expenses and profit for the period you chose.
- Choose a Timeline. The choices are the same as in Lead Reports.
- Choose a Transaction Type: All Types, Income or Expense.
The cards show Total Revenue, Total Expenses, Net Profit and Profit Margin. Revenue vs Expenses compares them month by month, and Revenue by Client shows your top 10 clients. The table lists your 10 most recent transactions. Use Search by client... to find one.
The Category box is on the page, but it does not change the results yet. Leave it on All Categories.
Look at one project
Open Project Reports and choose a project under Select Project. Each project is listed with its name and code, such as Arden & Pike Intake Automation (ARD-04).
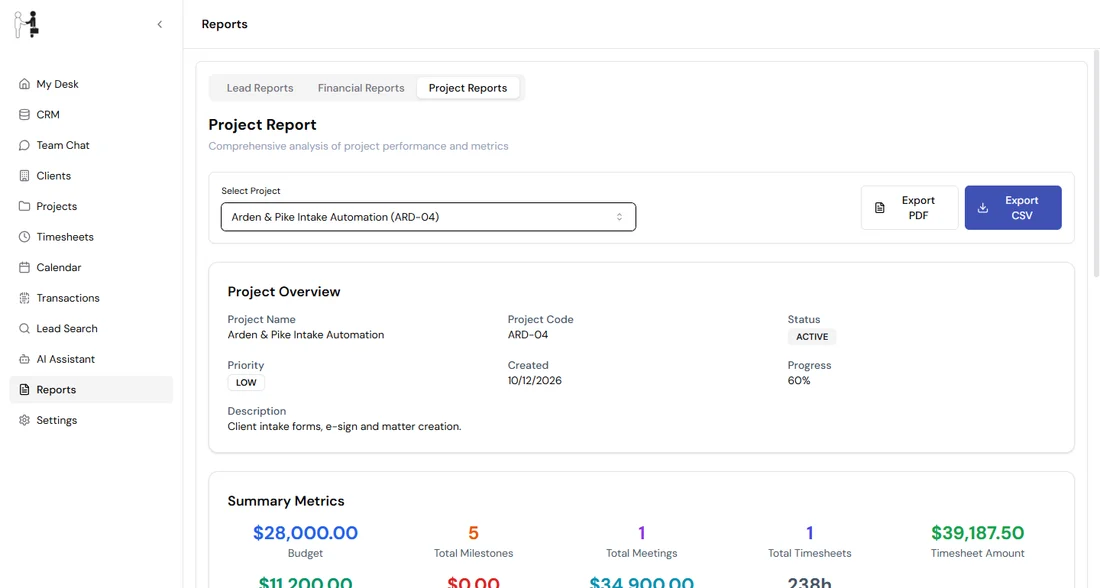
Figure 3. Pick a project to see its full report.
The report shows Project Overview and Summary Metrics: the budget, invoice payments, income, expenses and timesheet hours. Below them it lists the project's Milestones, Timesheets, Meetings, Transactions (Income & Expenses), Team Members and Clients. A section only appears when the project has something to show in it. If a project has no data you see No report data available for the selected project.
Download a report
Every tab has two buttons.
- Export CSV downloads a spreadsheet file. For leads it holds the contact name, email, source, stage and created date. For finances it holds the date, client, description, type, amount and merchant.
- Export PDF downloads a formatted report. While it is being made you see Generating PDF report..., then PDF exported successfully.
A CSV file holds what the table shows: up to 100 leads, or the 10 most recent transactions. A PDF lists only the 20 most recent leads, so use the CSV file when you need all of them. You see Lead report exported successfully or Financial report exported successfully when a CSV finishes. If there is nothing to export you see No lead data available to export or No financial data available to export. The buttons stay off while the page is loading, so wait for the numbers to appear first.